
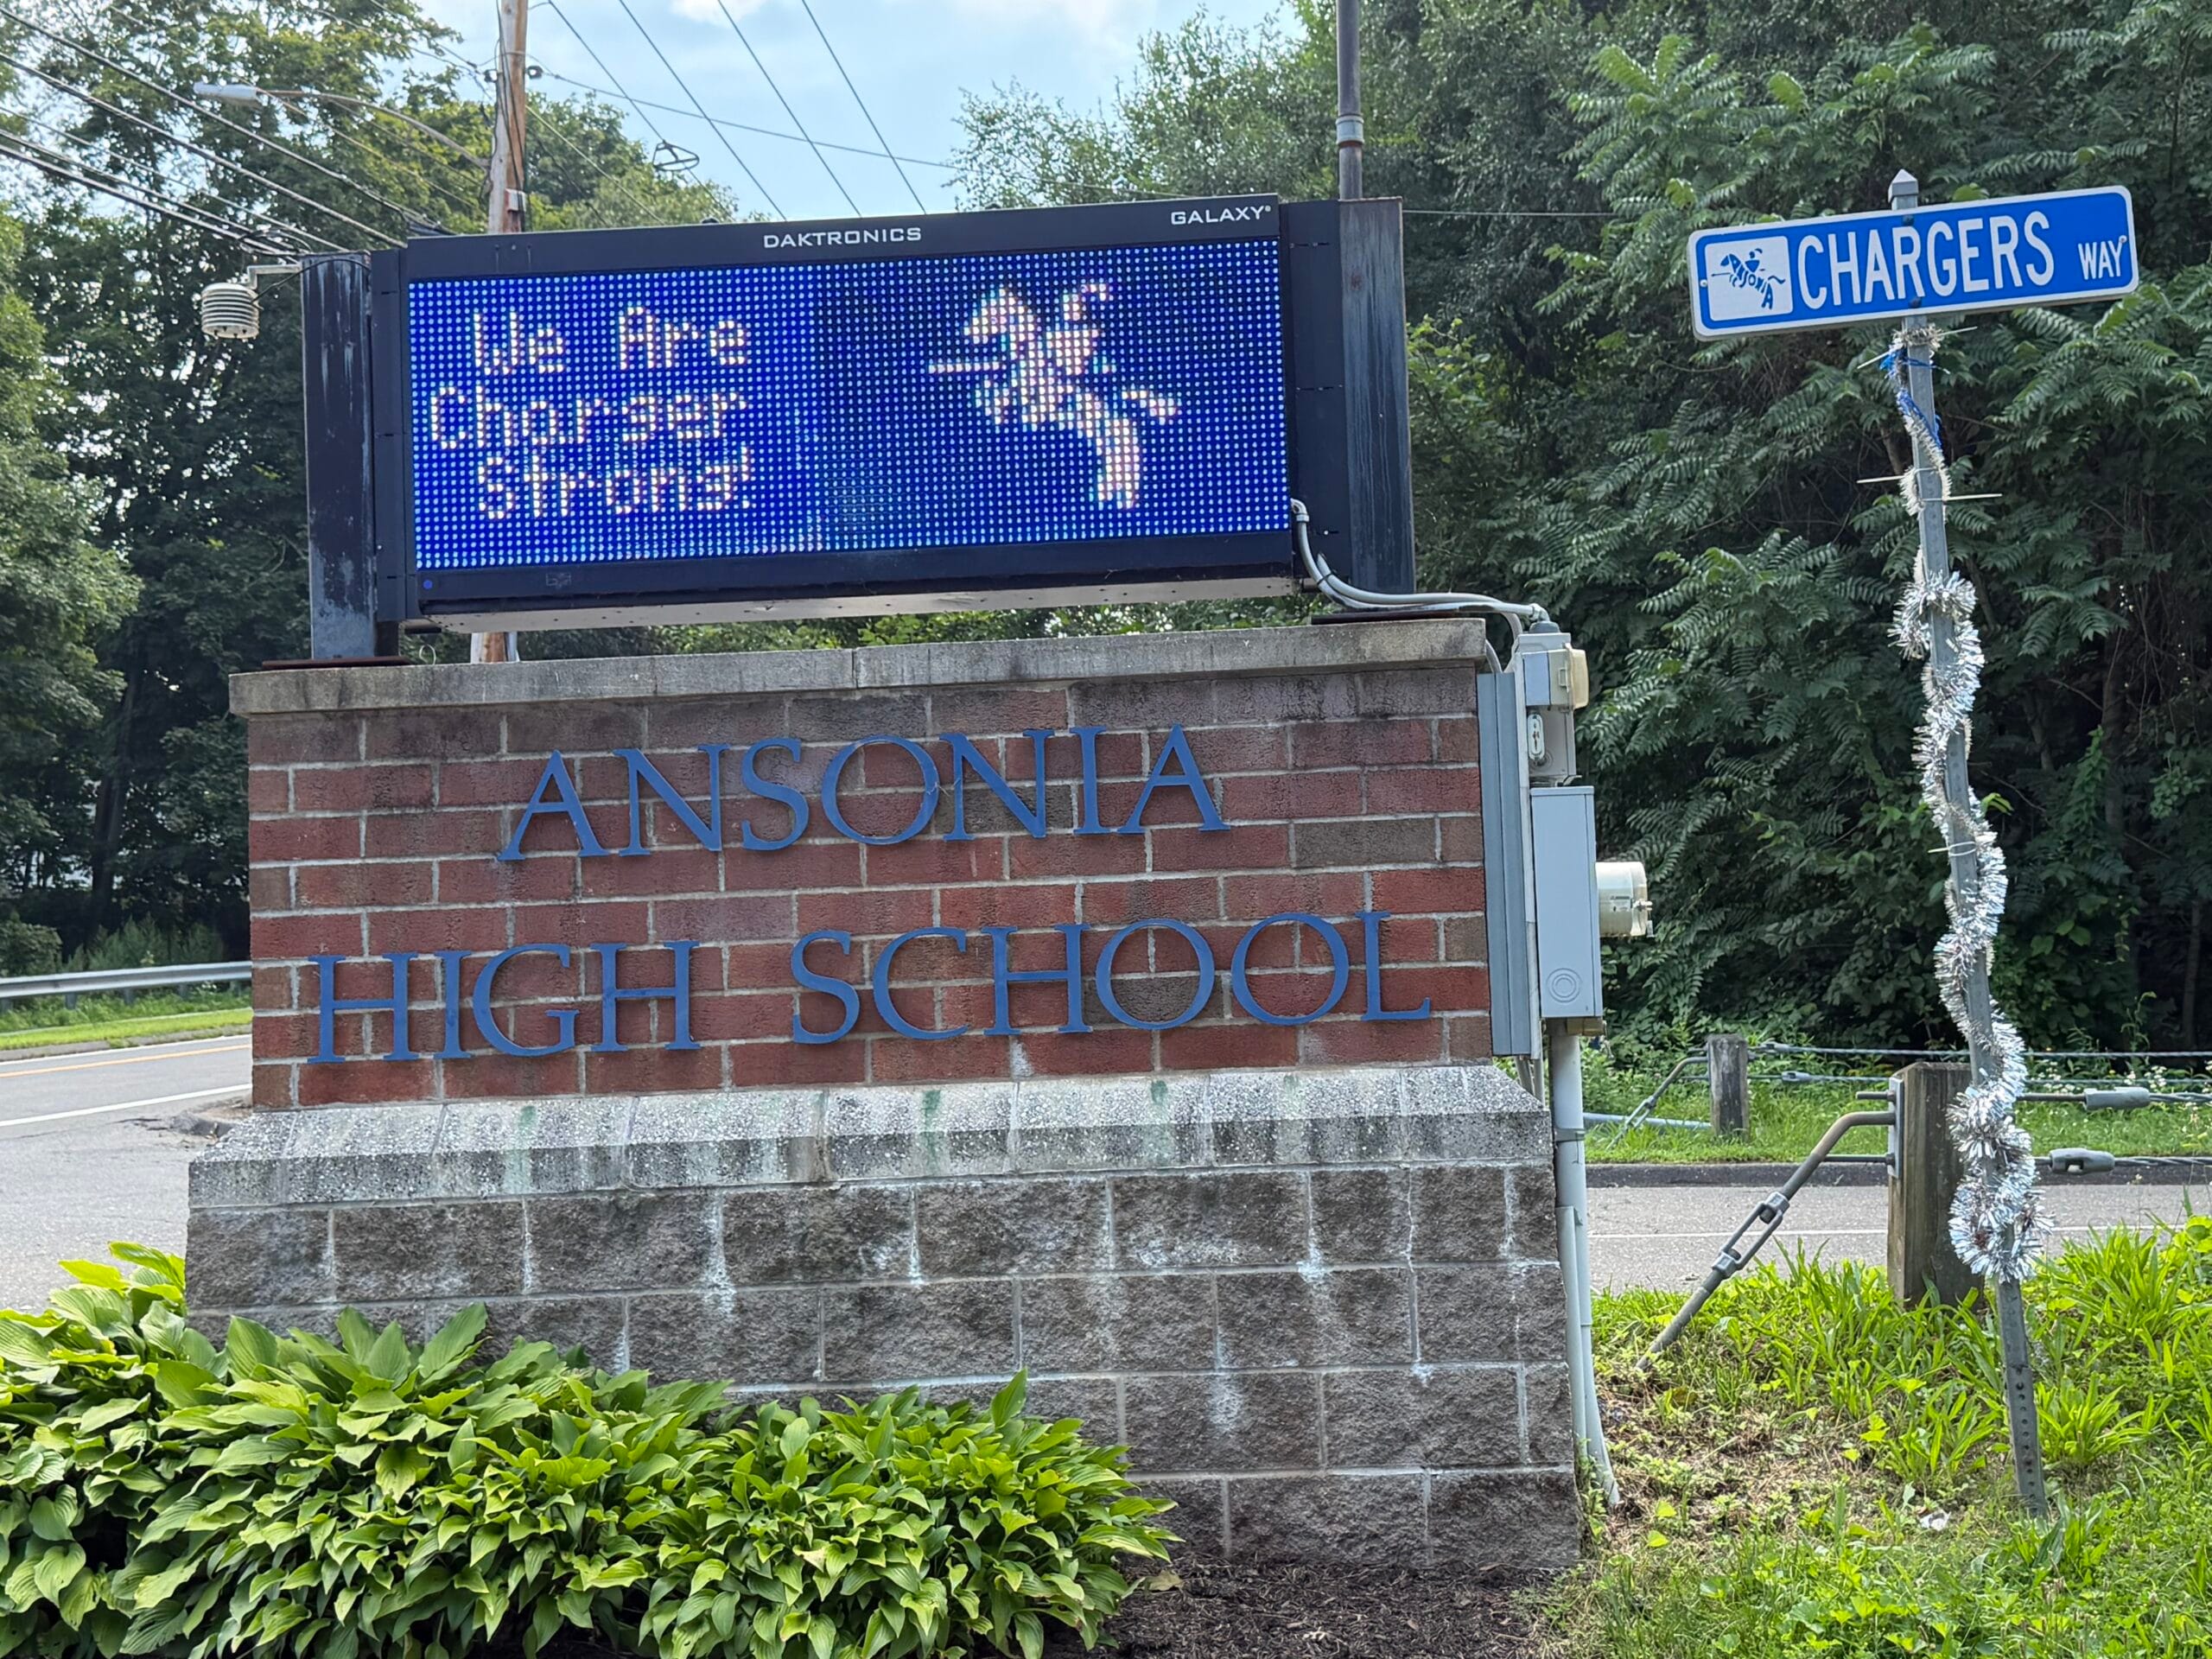

ANSONIA, Connecticut.— The Ansonia Public School District faces a reality that reflects some of the greatest challenges in public education in Connecticut. It serves a population with high levels of economic and educational need, has fewer resources per student than the state average, and continues to register significant academic gaps.
At the same time, official documents show progress, investments in specialized programs, and signs of recovery that offer a more complex picture of the system.
Receive breaking news alerts
Immigration, New York, Dominican Republic and investigative news delivered directly to your phone and computer.

Free — unsubscribe anytime.
According to the 2024-2025 profile published by EdSight, the information platform of the Connecticut Department of Education, Ansonia recorded 2,404 students as of October 1, 2024. Of those, 49.3% were Hispanic, 21.7% African American, and 22.2% white. A state report on Alliance Districts further establishes that 1,708 students, equivalent to 71%, were classified as high needs. Students with disabilities accounted for 18% of enrollment.
The district is led by Superintendent Joseph DiBacco, accompanied by Stephen Bergin as Assistant Superintendent. Nicole Fenech leads Special Services, and the Board of Education is chaired by Chris Phipps.
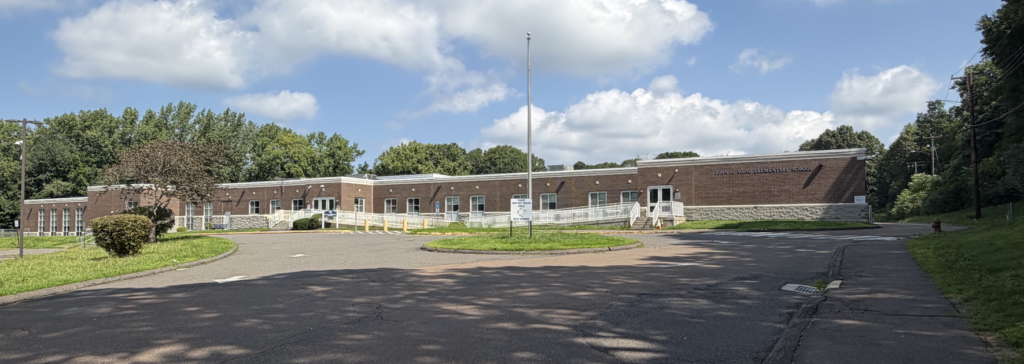
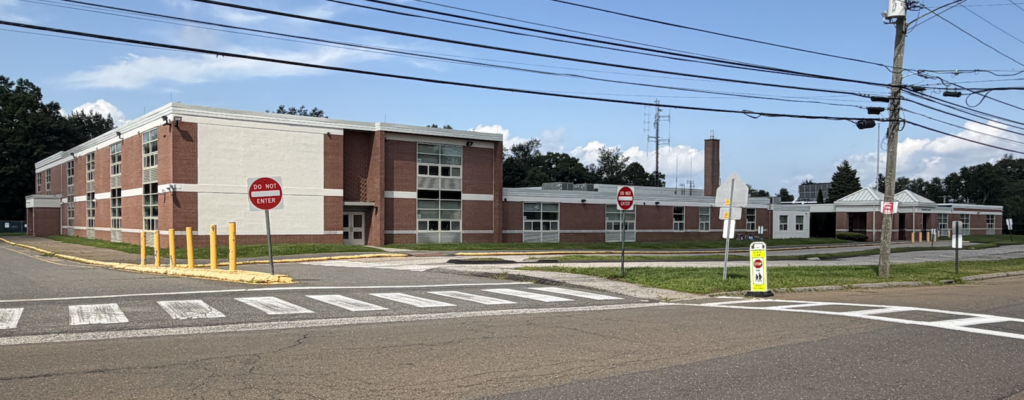
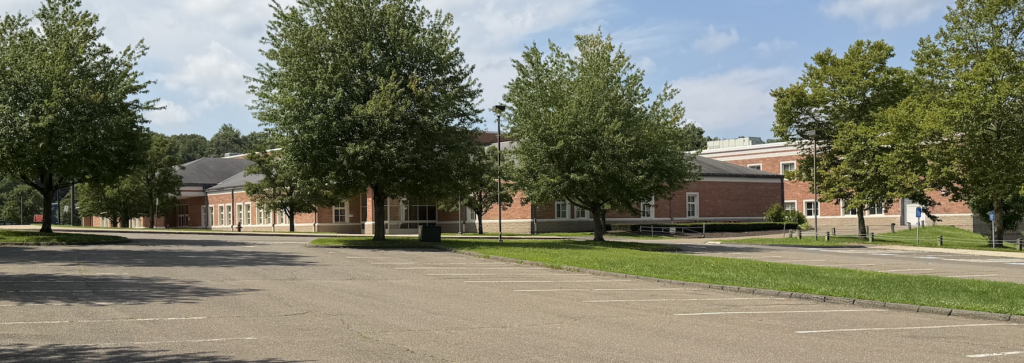
The main schools are Mead Elementary, led by Amy Cosciello; Prendergast Elementary, under Elizabeth Nimons; Ansonia High School, headed by Paul Giansanti; and Ansonia Middle School, led by Robert Durand.
Results That Show the Challenge
Official Department of Education data show that the main challenge continues to be academic.
During 2024-2025, Ansonia recorded a performance index of 52.6 in English Language Arts, compared with 64.7 for Connecticut. In mathematics, it scored 48.3 compared with 61.1 statewide, and in science, 48.3 compared with 62.6.
Among students with disabilities, the indexes were considerably lower: 33.2 in reading and writing, 28.1 in mathematics, and 33.7 in science.
However, the historical trend presented by the Department of Education shows a gradual recovery. The district’s Accountability Index, which stood at 66.8 during 2018-2019, fell to 61.4 in 2021-2022 and reached 65.2 in 2024-2025. Ansonia has not yet fully recovered its pre-pandemic level, but it has regained some of the ground lost.
One of the positive results appears among students who are learning English. According to EdSight, Ansonia recorded 61.6% on the indicator of progress toward written language proficiency, compared with 58.7% statewide, and 58.5% in oral progress, compared with 55.7% for Connecticut.
Access to college and career preparation programs also stands out. The state indicator for participation in College and Career Readiness courses reached 95.7%, compared with 92.4% statewide.
But the same records show a difference between participation and results. Only 36.4% of students in grades 11 and 12 demonstrated postsecondary readiness through the indicators established by the State, compared with 47.2% for Connecticut.
Graduation, College, and Attendance
The state profile places Ansonia’s four-year graduation rate at 85.7%, compared with 88.9% for Connecticut.
The differences among groups are significant. Graduation reached 94.9% among white students, 84.8% among Hispanic students, and 77.8% among students of African descent.
The transition to higher education presents another challenge. According to EdSight, 53.4% of graduates from the class of 2024 entered an institution of higher education during the following year, compared with 67% statewide. Among Ansonia’s Hispanic students, the proportion was 36.1%.
Absenteeism Possibly Constitutes One of the Greatest Barriers to Improving Those Results
The Department of Education reported that 23.1% of students were considered chronically absent during 2024-2025, compared with 17.2% statewide. Among students with disabilities, the proportion reached 34.8%, and among Hispanic students, 26.8%.
The state report on Alliance Districts shows, however, an improvement compared with 2021-2022, when chronic absenteeism in Ansonia reached 25.1%.
The Weight of Special Education
Special education constitutes one of the district’s greatest academic and financial responsibilities.
According to EdSight, Ansonia allocated $14.6 million to special education during 2023-2024, equivalent to 28.7% of its educational expenditures, compared with 25.7% statewide.
Of that amount, $5.56 million corresponded to special education tuition expenses, equivalent to 38% of spending in this area, compared with 22.8% statewide. Specialized transportation represented another $2.02 million.
State records further indicate that 49 students with disabilities under Ansonia’s financial responsibility were placed in public schools in other districts and another 16 in private schools or other educational settings.
Another indicator deserves attention. Only 47.2% of students with disabilities between the ages of 6 and 21 spent at least 80% of their school day alongside students without disabilities, compared with 68% statewide.
These figures do not mean that the placements are inappropriate. Some students require highly specialized services that a small district may not be in a position to provide. However, the data raise a question about the possibility of developing greater specialized capacity within the district itself.
Prendergast Under Transformation
Prendergast Elementary School represents one of the largest transformation efforts currently underway.
Minutes and documents from the Connecticut State Board of Education confirm that the agency formally approved Prendergast’s Commissioner’s Network Turnaround Plan in June 2025.
The plan includes evidence-based teaching practices, professional development, use of data, strengthening teacher leadership, and interventions aimed at high-needs students, multilingual students, and students with disabilities.
Principal Elizabeth Nimons and Superintendent DiBacco participated before state education authorities during the plan evaluation process.
Prendergast’s future results will make it possible to measure whether that intervention succeeds in transforming new strategies and resources into sustainable academic improvements.
The Reality of Funding
Money constitutes another fundamental component in understanding Ansonia’s schools. According to EdSight, the district spent $19,869 per student during 2023-2024, compared with $22,054 statewide, a difference of $2,185 per student.
However, the same records show an important particularity: Ansonia allocated $13,983 per student directly to instruction, slightly above the statewide average of $13,471.
This means that the financial situation cannot be explained simply by stating that Ansonia invests little in classrooms. The district concentrates a considerable proportion of its resources on instruction and special education while having less total money available per student.
Dependence on external funding is also significant. State records show that 41% of educational resources came from local sources, 46.5% from the State, 12% from the federal government, and 0.6% from tuition and other sources.
Auditors Detected Administrative Problems
Finances have also generated warnings.
The audit for the fiscal year ended June 30, 2025, identified problems related to the Board of Education’s financial procedures as a significant deficiency.
The auditors determined that there were not sufficient regular operating procedures to produce complete and accurate financial information, that the school operating fund was not being reconciled monthly with the city, and that several funds required corrections. The report further noted that this was a repeated finding from the previous year.
The administration presented a corrective action plan that includes training, financial procedures, better use of available systems, and coordination between municipal and school financial personnel.
Precision is also important at this point: the auditors issued an unmodified opinion on the financial statements, identified no material weaknesses, and reported no questioned costs in the major federal or state programs examined.
A Teaching Staff Very Different From Its Students
State data reveal another challenge.
While 49.3% of Ansonia students were Hispanic and 21.7% African American, records for certified staff showed a considerably different composition.
Of 227 certified educators reported, 216 were white, equivalent to 95.2%. Three were Hispanic, four were of African descent, three were Asian, and one belonged to two or more racial groups.
The difference raises a legitimate question about the district’s future recruitment and diversity strategies, particularly in a system whose student population is predominantly made up of minority communities.
Two Realities Within the Same District
Official documents ultimately present two realities that exist simultaneously.
Ansonia remains below the state average in fundamental academic areas and faces significant challenges in attendance, postsecondary readiness, special education, and financial administration.
But the same documents show a district that serves a population with high levels of need, has $2,185 less per student than the state average, has regained some of the ground lost after the pandemic, exceeds Connecticut in certain indicators of progress among students who are learning English, and is developing transformation strategies in some of its schools.

Comments (0)
Be the first to join the conversation.